Debugging Your Code: Tips and Tricks for Developers – sounds boring, right? Wrong! This isn’t your grandpappy’s debugging guide. We’re diving deep into the messy, glorious world of finding and fixing those pesky code gremlins. Forget cryptic error messages; we’ll arm you with the strategies, tools, and secret ninja moves to conquer any coding challenge. Get ready to become a debugging master!
From understanding the fundamental debugging process and identifying those sneaky bugs, to mastering advanced techniques like tackling memory leaks and multithreaded mayhem, we’ll cover it all. We’ll explore different debugging tools across various IDEs, showing you how to leverage their power for efficient troubleshooting. We’ll even delve into best practices to prevent bugs before they even hatch, saving you countless hours of frustration. Think of this as your ultimate survival guide in the wild west of software development.
Understanding the Debugging Process
Debugging—that thrilling moment when you wrestle with your code until it behaves. It’s a crucial skill for any developer, transforming frustration into a satisfying “aha!” moment. Mastering the debugging process isn’t about luck; it’s a systematic approach.
Effective debugging involves a series of steps that, when followed diligently, can significantly reduce the time spent hunting down pesky bugs. These steps are iterative and often overlap, meaning you might jump between them as you gain more understanding of the problem.
Debugging Strategies Across Programming Paradigms, Debugging Your Code: Tips and Tricks for Developers
Debugging strategies vary slightly depending on the programming paradigm. In procedural programming, you’re often tracing the flow of execution line by line, checking variable values at each step. Object-oriented programming introduces the added complexity of interacting objects and their methods. Here, you might need to debug not just the code within a method, but also the interactions between different objects and their states. For example, a bug in a procedural program might stem from an incorrect calculation, while in an object-oriented program, the bug could be due to an object receiving incorrect data from another object. This requires a more holistic approach, focusing on object interactions and data flow.
A Typical Debugging Workflow
The following flowchart illustrates a typical debugging workflow. Imagine it as a detective’s guide to solving code mysteries.
“`
[Start] –> [Identify the Bug] –> [Reproduce the Bug] –> [Isolate the Problem] –> [Formulate a Hypothesis] –> [Test the Hypothesis] –> [Implement Solution] –> [Verify Solution] –> [End]
“`
The flowchart shows a linear process, but in reality, debugging is often iterative. You might need to repeat steps, refine your hypothesis, or even revisit earlier stages as new information emerges.
Common Debugging Tools Across Various IDEs
Choosing the right debugging tools can dramatically speed up the process. Different IDEs offer a range of features, each with its own strengths and weaknesses.
| IDE | Debugger Features | Strengths | Weaknesses |
|---|---|---|---|
| VS Code | Breakpoints, step-over/into/out, watch expressions, call stack visualization, variable inspection | Lightweight, highly extensible, excellent community support, cross-platform compatibility. | Can be less intuitive for beginners compared to more mature IDEs. |
| IntelliJ IDEA | Comprehensive debugging capabilities, including smart step into, data breakpoints, remote debugging, and integration with various testing frameworks. | Powerful and feature-rich, excellent for large-scale projects, robust refactoring tools. | Resource-intensive, can be slower on less powerful machines. Can have a steeper learning curve. |
| Eclipse | Breakpoints, step-over/into/out, variable inspection, expression evaluation, remote debugging. | Mature and stable, widely used in enterprise environments, large plugin ecosystem. | Can feel clunky and less responsive compared to newer IDEs. |
Identifying and Isolating Bugs
So, you’ve got a bug. That sinking feeling in your stomach, the frantic scrolling through lines of code… we’ve all been there. But don’t panic! Finding and fixing bugs is a crucial skill for any developer, and with the right strategies, you can transform that frustration into a satisfying “aha!” moment. This section will equip you with the detective skills needed to track down those pesky errors.
Identifying the source of a bug often feels like searching for a needle in a haystack – except the haystack is your codebase, and the needle is a tiny, elusive error. The key is a systematic approach. Start by carefully examining the error messages your code produces. These messages often provide clues about the location and nature of the problem. Don’t just glance at them – dissect them! Look for specific file names, line numbers, and descriptions of the error. This initial information is your first breadcrumb trail.
Common Coding Errors and Their Symptoms
Understanding the typical symptoms of common coding errors is half the battle. For instance, a `NullPointerException` in Java often indicates that you’re trying to access a member of an object that hasn’t been initialized or is currently null. This might manifest as a sudden crash or unexpected behavior. Similarly, an `IndexOutOfBoundException` suggests you’re trying to access an array element outside its valid range – leading to crashes or incorrect data manipulation. A simple typo in a variable name, on the other hand, might lead to subtle, hard-to-detect issues where the program compiles but produces incorrect results. Recognizing these patterns helps you narrow down your search.
Utilizing Logging and Print Statements
Logging and strategically placed `print` statements (or their equivalents in your chosen language) are your best friends in debugging. Think of them as breadcrumbs you leave for yourself as you navigate the code’s execution path. By inserting `print` statements at various points in your code, you can track the values of variables, monitor the flow of execution, and identify where things start going wrong. For example, printing the value of a variable just before a suspected error point can reveal if it holds the expected value or if it’s unexpectedly null or incorrect. Robust logging frameworks offer more advanced features like logging to files, different log levels (debug, info, warning, error), and the ability to filter log messages, which is particularly useful in larger projects.
Breakpoints and Debuggers: Advantages and Disadvantages
Debuggers are powerful tools that allow you to pause the execution of your program at specific points (breakpoints), inspect the state of your variables, step through the code line by line, and even modify variables on the fly. This interactive approach provides an unparalleled level of insight into your program’s behavior. The advantage is a highly targeted and efficient debugging process. However, using a debugger effectively requires some learning curve. Setting breakpoints correctly, interpreting the debugger’s interface, and understanding how to navigate through the call stack can be challenging for beginners. Furthermore, debuggers might not be suitable for all debugging scenarios, particularly in embedded systems or highly distributed environments.
Utilizing Debugging Tools
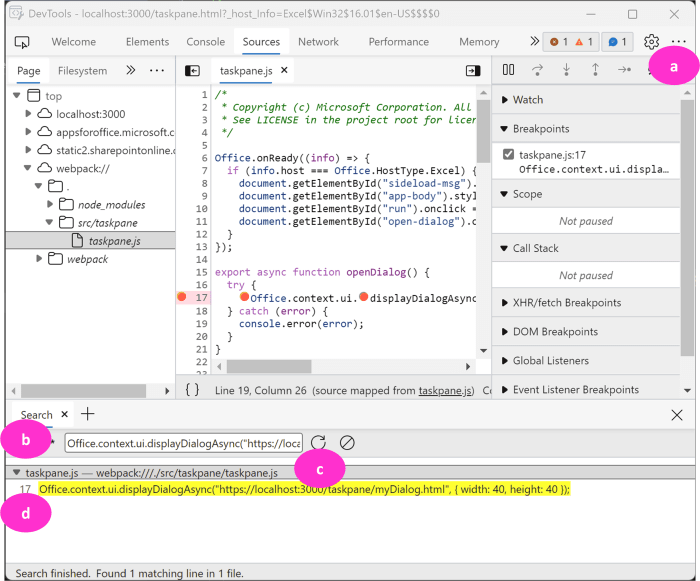
Source: microsoft.com
Let’s face it, even the most seasoned developers encounter bugs. The good news? Effective debugging tools can transform the frustrating process of bug hunting into a streamlined, efficient task. Mastering these tools is key to faster development cycles and less hair-pulling.
Debugging tools aren’t just for beginners; they’re essential for any developer who wants to write cleaner, more robust code. They offer a powerful lens into your program’s execution, allowing you to pinpoint errors with precision. Think of them as your code’s X-ray machine, revealing hidden issues that would otherwise remain elusive.
Stepping Through Code Execution
Debuggers allow you to execute your code line by line, pausing at any point to inspect variables and understand the program’s state. This “step-through” functionality provides an unparalleled level of control and insight. For example, imagine a loop with unexpected behavior. Using a debugger, you can step through each iteration, observing the loop counter, the values of relevant variables, and the conditions that govern the loop’s continuation. This granular level of examination quickly isolates the source of the problem. This is particularly useful when dealing with complex logic or recursive functions where tracing the execution flow manually is impractical.
Inspecting Variables and Their Values
A key feature of debuggers is the ability to inspect the values of variables at any point during execution. This is crucial for understanding the program’s state and identifying incorrect calculations or unexpected variable assignments. Many debuggers provide a dedicated window or panel where you can view the current values of variables, including their data types and memory addresses. This feature is invaluable for identifying subtle errors that might not be apparent from simply examining the code’s structure. For instance, if a variable is unexpectedly null or contains an incorrect value, the debugger will instantly reveal this discrepancy, significantly speeding up the debugging process.
Using Debugger Features: A Step-by-Step Guide (Python’s pdb)
Let’s walk through a practical example using Python’s built-in debugger, `pdb`. Assume we have a simple function with a bug:
“`python
def buggy_function(x, y):
result = x / y
return result
print(buggy_function(10, 0))
“`
1. Insert Breakpoint: Add a breakpoint using `import pdb; pdb.set_trace()` where you want debugging to begin. For our example, let’s place it before the `result = x / y` line:
“`python
def buggy_function(x, y):
import pdb; pdb.set_trace()
result = x / y
return result
print(buggy_function(10, 0))
“`
2. Run the Code: Execute your script. The debugger will halt at the breakpoint.
3. Use `n` (next): The `n` command steps to the next line of code. Use this to traverse the function’s execution.
4. Use `p` (print): The `p` command allows you to print the value of a variable. For example, `p x` will display the value of `x`.
5. Use `c` (continue): The `c` command continues execution until the next breakpoint or the end of the program.
6. Inspect the Call Stack: The call stack shows the sequence of function calls that led to the current point in execution. This is particularly useful for tracking down errors in recursive functions or when dealing with multiple function calls. `pdb` provides commands to navigate the call stack.
7. Set Watchpoints: Watchpoints allow you to pause execution when a specific variable’s value changes. This is useful for tracking down subtle changes in variables that might be causing unexpected behavior. `pdb` doesn’t directly support watchpoints in the same way as some more advanced debuggers, but you can achieve similar functionality through repeated use of the `p` command.
Comparing Debuggers: pdb (Python) vs. GDB (C++)
Python’s `pdb` is a lightweight, integrated debugger ideal for quick debugging sessions. It’s easy to use and seamlessly integrates into the Python development environment. However, it lacks some advanced features found in more powerful debuggers.
GDB (GNU Debugger), on the other hand, is a much more comprehensive debugger primarily used for C and C++. It offers a wider array of features, including powerful breakpoint management, sophisticated watchpoints, and extensive call stack analysis. GDB is more complex to learn than `pdb`, but its advanced capabilities are essential for debugging larger, more intricate C++ projects. The choice between `pdb` and GDB, or similar debuggers for other languages, depends on the complexity of your project and your debugging needs.
Advanced Debugging Techniques: Debugging Your Code: Tips And Tricks For Developers
So you’ve mastered the basics of debugging—you can identify simple errors, use your debugger effectively, and even isolate problems in smaller code chunks. But what happens when the bugs get sneaky? When they lurk in the depths of memory or the chaos of concurrent processes? That’s where advanced debugging techniques come into play. This section dives into strategies for tackling the most challenging debugging scenarios.
Memory-Related Bugs
Memory errors are notoriously difficult to track down. They often manifest subtly, leading to unpredictable crashes or seemingly random behavior. Two common culprits are memory leaks and segmentation faults. Memory leaks occur when your program allocates memory but fails to release it, gradually consuming available resources until the system crashes. Segmentation faults, on the other hand, happen when your program tries to access memory it doesn’t have permission to access, typically resulting in an immediate crash. Understanding these issues is crucial for building robust applications.
Debugging Concurrent Programs
Debugging multithreaded or concurrent applications introduces a whole new level of complexity. The non-deterministic nature of concurrent execution means that bugs might only appear under specific timing conditions, making them incredibly hard to reproduce. Traditional debugging techniques often fall short here. Strategies for debugging concurrent programs often involve using specialized debugging tools that allow you to inspect the state of multiple threads simultaneously, identify race conditions, and track down deadlocks. Careful logging and the use of synchronization primitives are also essential for understanding the flow of execution in concurrent code.
Debugging Production Applications
Debugging in a production environment requires a different approach than debugging during development. You’re dealing with a live system, and you need to minimize disruption to users. Strategies here often involve careful logging, remote debugging tools, and sophisticated monitoring systems. Analyzing logs, identifying patterns in error reports, and using tools to capture snapshots of the system’s state at the time of the error are crucial steps in pinpointing the root cause of a production bug without causing further issues. Consider using techniques like canary deployments or A/B testing to isolate and test fixes in a controlled manner before rolling them out to all users.
Effective Use of Error Messages and Stack Traces
Error messages and stack traces are your best friends when debugging. A well-crafted error message should clearly describe the nature of the error, its location in the code, and any relevant context. The stack trace, a sequence of function calls leading up to the error, provides a crucial roadmap for tracing the execution path and identifying the source of the problem. Learning to effectively interpret and utilize this information is a fundamental skill for any developer. For example, a stack trace might show a `NullPointerException` at line 123 of `MyClass.java`, indicating that a variable was unexpectedly null. By examining the code around line 123 and the functions called before it, you can often quickly determine the root cause.
Preventing Bugs Through Best Practices
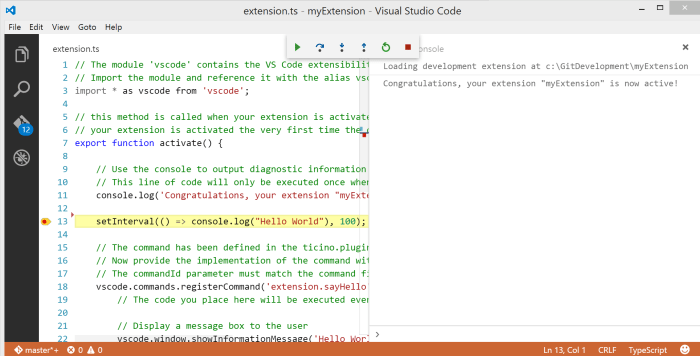
Source: readthedocs.io
Debugging code? It’s like a detective story, tracing errors to their source. Sometimes, the process feels as complicated as figuring out the best car insurance, especially if you need to know How to Insure Your Vehicle When You’re Not the Primary Driver , which can be surprisingly tricky. But back to debugging – remember to check your variables and use a debugger; it’ll save you hours of frustration.
Writing clean, efficient code isn’t just about aesthetics; it’s the cornerstone of preventing bugs and making your life (and your future self’s life) significantly easier. Proactive bug prevention is far more efficient than endless debugging sessions. By adopting certain coding styles and best practices, you can dramatically reduce the likelihood of errors creeping into your projects.
Adopting a robust set of best practices significantly reduces the time spent hunting down elusive bugs. This translates to faster development cycles, happier developers, and ultimately, higher-quality software. Let’s explore some key strategies.
Coding Styles and Best Practices for Minimizing Bugs
Consistent and well-structured code is easier to understand and maintain. This directly reduces the chance of introducing bugs during modifications or extensions. Using a consistent indentation style (e.g., 4 spaces), naming conventions (e.g., camelCase for variables), and commenting practices improves readability. For example, always using descriptive variable names like `userFirstName` instead of `x` makes the code’s purpose instantly clear. Furthermore, employing modular design, breaking down complex tasks into smaller, manageable functions, makes code easier to test and debug. Each function should ideally have a single, well-defined purpose.
Self-Documenting Code Techniques
Well-written code often explains itself. Descriptive variable and function names are crucial. Consider this: `calculateTotalCost(price, quantity)` is far more self- than `calc(p, q)`. Adding concise comments to explain complex logic or non-obvious code sections is also beneficial. Avoid excessive commenting, though; good code should be mostly self-documenting. Using docstrings (documentation strings) for functions and classes provides a formal way to document their purpose, parameters, and return values. For example, a Python docstring might look like this:
“`python
def calculate_area(length, width):
“””Calculates the area of a rectangle.Args:
length: The length of the rectangle.
width: The width of the rectangle.Returns:
The area of the rectangle.
“””
return length * width
“`
This approach ensures that the code’s purpose and functionality are clearly understood, even without extensive context.
The Importance of Code Reviews and Peer Programming
Code reviews are an invaluable tool for catching bugs early in the development process. A fresh pair of eyes can often spot errors that the original author might have missed. Peer programming, where two developers work together on the same code, provides a real-time opportunity for collaborative debugging and code improvement. This process promotes knowledge sharing and fosters a culture of quality within the development team. It also helps to enforce coding standards and best practices.
Common Coding Pitfalls and How to Avoid Them
Preventing bugs often involves avoiding common pitfalls. Here are some frequently encountered issues and strategies to prevent them:
- Off-by-one errors: These occur when loops or array indices are incorrectly handled. Carefully check loop conditions and array boundaries. Use debugging tools to step through the code and verify the values of loop counters and indices.
- Null pointer exceptions: These occur when attempting to access a member of an object that is null. Always check for null values before accessing object members. Use conditional statements or optional chaining to handle null values gracefully.
- Type errors: These occur when using variables of incorrect data types. Use static typing (where supported) to enforce type safety. Utilize type checking functions or libraries to validate data types at runtime.
- Unhandled exceptions: Failing to handle exceptions can lead to program crashes. Use try-catch blocks to handle potential exceptions and prevent program termination. Provide informative error messages to aid in debugging.
- Race conditions: These occur in concurrent programming when multiple threads access and modify shared resources without proper synchronization. Use locks, mutexes, or other synchronization mechanisms to prevent race conditions.
Illustrative Examples
Debugging isn’t just about knowing the tools; it’s about applying that knowledge to real-world scenarios. Let’s dive into some examples that illustrate common debugging challenges and their solutions. These examples highlight the importance of methodical troubleshooting and the power of different debugging techniques.
Let’s explore a complex scenario and then delve into a specific debugging technique with a code example. We’ll also visualize a memory leak, a sneaky bug that can crash even the most robust applications.
A Complex Bug: The Case of the Vanishing User Data
Imagine a web application where users can upload and manage their profiles. One day, users start reporting that their profile information – their name, bio, and uploaded images – randomly disappears. The error logs show nothing specific. This isn’t a simple typo or a missing semicolon. This is a complex bug that requires a systematic approach.
First, we’d examine the database. We check for inconsistencies, missing records, or corrupted data. If the data isn’t in the database, the problem lies in the application’s data saving mechanism. Next, we investigate the application’s code, focusing on the profile saving functionality. We use a debugger to step through the code line by line, examining variable values at each step. We find that a seemingly innocuous line of code within a nested loop, responsible for updating the user profile, has a subtle flaw that causes it to overwrite the database entry under certain conditions, conditions we initially didn’t realize would be possible in the application’s architecture. This was causing intermittent data loss. By correcting this loop, the problem was solved. The key here was meticulous tracing, combined with a thorough examination of the data storage process.
Using a Debugger: Stepping Through a Loop
Let’s consider a simple Python function that’s supposed to calculate the sum of even numbers in a list:
“`python
def sum_even(numbers):
total = 0
for number in numbers:
if number % 2 == 0:
total += number
else:
total -= number #Incorrect Logic
return total
numbers = [2, 4, 6, 1, 3, 5]
result = sum_even(numbers)
print(f”The sum of even numbers is: result”)
“`
This function has a bug: it subtracts odd numbers instead of ignoring them. Using a debugger (like pdb in Python), we can step through the code line by line. We set a breakpoint at the beginning of the loop. As the debugger executes each iteration, we can inspect the values of `number` and `total`. We quickly see that `total` is being incorrectly decremented when `number` is odd. By correcting the `else` block to simply not modify `total` when the number is odd, we resolve the issue. The corrected function would be:
“`python
def sum_even(numbers):
total = 0
for number in numbers:
if number % 2 == 0:
total += number
return total
numbers = [2, 4, 6, 1, 3, 5]
result = sum_even(numbers)
print(f”The sum of even numbers is: result”)
“`
Visualizing a Memory Leak
Imagine a program that repeatedly creates objects without releasing them. These objects occupy memory. Visualize a container (memory) gradually filling up with these objects. Each object is a small block, and as more objects are created without being deleted, these blocks pile up, taking up more and more space. Eventually, the container overflows, leading to a crash or significant performance degradation. Detecting memory leaks involves using memory profiling tools that track object allocation and deallocation. These tools can identify objects that are no longer needed but are still held in memory. By identifying these lingering objects and modifying the code to properly release them (e.g., using garbage collection mechanisms or explicit deallocation), we can prevent the memory leak. The visualization is like watching a container slowly fill with blocks until it spills over.
Conclusion
So, there you have it – your cheat sheet to conquering the coding chaos. Mastering debugging isn’t just about fixing errors; it’s about becoming a more efficient, insightful, and ultimately, a more badass developer. Remember, every bug squashed is a victory, a testament to your problem-solving prowess. Go forth, debug fearlessly, and may your code always compile (on the first try!).


